Common Online Data Analysis Platform (CODAP)
codap.concord.org
CODAP (the Common Online Data Analysis Platform) is a free, browser-based data analysis tool for use across KS3, KS4, and KS5. Pupils work with real, often large, multivariate datasets in a table, then drag attributes onto graphs and maps that stay dynamically linked to one another and to the table they came from. The aim is not to teach one chart type at a time but to make interrogating data, sampling it, comparing groups, fitting lines, testing whether a pattern could be chance, a common classroom activity.
How the tool works
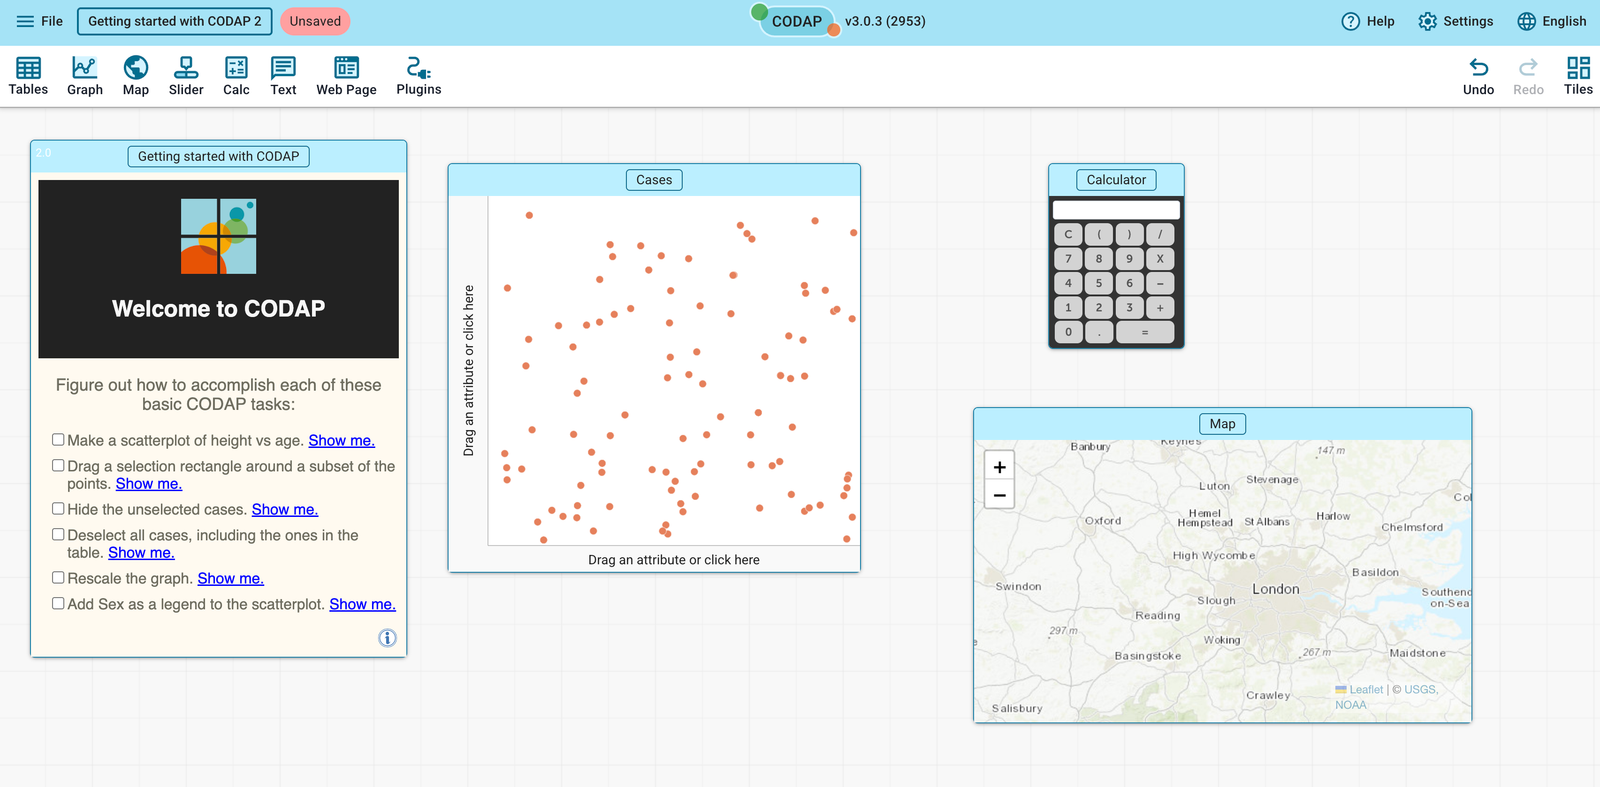
The toolbar runs Tables, Graph, Map, Slider, Calc, Text, Web Page, and Plugins. Everything else follows from dragging between them.
- Tables hold cases and attributes. Rows are cases, columns are attributes. Data can be typed in by hand, pasted from a spreadsheet, or dragged in as a CSV.
- Graphs build themselves. Clicking Graph creates an empty plot with points scattered at random; dragging an attribute from a column header onto an axis snaps the points into a dot plot, bar chart, or scatter graph, with CODAP choosing the display type automatically.
- Everything is linked. Selecting a case in the table highlights it in every graph and on any map at once, and vice versa. There is no "refresh" step.
- Dragging a category to the left of a table groups the data by it, creating parent/child levels (for example, grouping pupils under class) without a formula.
- Data points can be dragged directly. Temporarily moving a point in a graph shows, live, what happens to the mean, median, or a fitted line — a direct way to see a statistic respond to a change in the data rather than just recalculate it.
- Movable Value and Movable Point add draggable reference lines. A Movable Value is a single draggable line on a graph with one numeric axis (useful for testing "is this the mean?" or for setting a threshold and reading off a count/percentage either side of it). A Movable Point is a draggable reference point on a scatter graph, used to test candidate points against the data.
- Sliders create a named, adjustable parameter that any formula in the document can reference; dragging the slider updates every dependent graph and calculated column live.
- Plugins extend CODAP for specific tasks. Built-in plugins include the Sampler (repeated random sampling/simulation), Scrambler and Testimate (statistical inference: randomisation tests, t-tests, chi-square, logistic regression), Transformers (produces a new dataset from an existing one, e.g. a running total or unit conversion, without altering the original), and Choosy (quickly hides/shows or tags attributes).
Getting started
- Open a dataset. Use File → "Open Example Document" for one of CODAP's curated datasets, or drag in a CSV.
- Click Graph. A blank plot appears with points scattered randomly.
- Drag an attribute onto an axis. The points organise themselves into a dot plot or bar chart; drag a second attribute onto the other axis for a scatter graph.
- Drop an attribute into the centre of the graph to colour points by that variable, creating an instant legend.
- Click the ruler icon to the right of a selected graph to add a mean/median line, a box plot, a Movable Value, or a least-squares regression line.
- Select a point in one graph and watch the same case highlight in the table and in any other open graph or map.
Central tendency and spread
Dragging a point to feel what a statistic does. With a mean line switched on via the ruler icon, temporarily dragging a data point up or down in the graph shows the mean line shift in response, live. This turns "the mean is sensitive to outliers" from a rule pupils memorise into something they cause and watch happen.
Movable Value as a guessing game. On a graph with one numeric attribute, adding a Movable Value gives pupils a draggable line they can place where they think the mean or median sits, before revealing the calculated line for comparison. The same Movable Value can report the count or percentage of cases either side of it, turning "roughly what proportion is above 50kg?" into a question answered by dragging rather than counting.
Box plots and comparing spread across groups. Promoting a categorical attribute to the table's parent level, or placing it on an axis, splits a single distribution into parallel dot plots or box plots automatically. Comparing two or more groups' spread is a re-arrangement of an existing graph, not a new one built from scratch.
Bivariate data and lines of best fit
Movable Point for testing a claim. On a scatter graph, a Movable Point is a single draggable reference point pupils can place anywhere. This can be useful for testing "would this value fit the pattern?" against real data before formal regression is introduced.
Movable line versus least-squares regression. The same scatter graph can carry a Movable Line, which pupils rotate and slide by eye to fit the data, alongside CODAP's calculated least-squares regression line. Placing both together turns "the regression line minimises the sum of squared residuals" from an assertion into something pupils can watch happen as they nudge their line towards the calculated one.
A third variable as colour. Dropping a categorical or numeric attribute into the centre of a scatter graph colours every point by that variable, letting pupils check whether an apparent correlation survives once a hidden grouping is made visible.
Simulation and statistical inference
Sampler for experimental versus theoretical probability. The Sampler plugin lets pupils configure a repeatable random draw. From a bag of coloured items, a set of named cards, or an existing dataset. Set the sample size and number of repeats, and run it. The output lands directly in a table, ready to graph, making the gap between a theoretical probability and an experimental relative frequency a live comparison rather than a page of pre-supplied results.
Scrambler for "could this be chance?" Scrambler builds a sampling distribution by randomly reassigning cases to groups many times over, then compares the real observed difference (say, in mean height between two groups) against the spread of differences produced purely by chance. This is a randomisation test made visible, and sits naturally alongside formal hypothesis testing.
Testimate for the formal tests themselves. Testimate performs t-tests, chi-square tests, proportion tests, and logistic regression directly inside CODAP, letting the informal randomisation logic built with Scrambler be checked against a named statistical test.
Classroom uses
KS3 - averages and spread pupils can drag. Load a small dataset of pupils' own collected data. With a mean line switched on, ask pupils to predict which point, if moved, would change the mean the most. Let them drag points and check.
Strategy: Add a Movable Value and ask pupils to place it where they think the median sits before revealing the calculated line. The gap between guess and answer is the lesson.
KS4 - bivariate data and comparing distributions for GCSE Statistics/Maths. Build a scatter graph (height vs shoe size, temperature vs ice-cream sales), add a Movable Line, then reveal the least-squares regression line for comparison.
Example: Colour the same scatter graph by a third categorical attribute (e.g. year group, or gender) so a trend visible overall can be checked against each subgroup — direct support for GCSE Higher content on correlation versus causation.
KS5 - sampling, inference, and the A-Level large data set. CODAP's linked, multivariate exploration maps directly onto the exam boards' large data set requirement for A-Level Mathematics. Import the specification dataset (or a comparable open dataset) and let pupils build and filter graphs to answer their own questions before a specific exam-style question is introduced.
Strategy: Use Scrambler to build a randomisation-based sampling distribution for a difference in means, then compare the real observed difference against it. A hands-on route into the logic of a hypothesis test before the formal \(t\)-test machinery is introduced.
Pedagogical roots
Most classroom statistics teaching is bottlenecked by data: textbook datasets are small, pre-cleaned, and exist to illustrate one technique at a time. CODAP inverts this by giving pupils large, slightly messy, genuinely interesting data and low-friction tools to interrogate it themselves. Dragging an attribute onto an axis takes far less effort than building a chart in a spreadsheet, so more of a lesson can be spent asking what does this tell us? rather than how do I make this chart? The dynamic linking between table, graph, and map does real conceptual work: seeing the same case highlighted in three places at once builds the idea that a case is a real thing with many attributes, not just a row of numbers. This is the foundation that bivariate analysis, sampling, and inference are built on. For A-Level in particular, CODAP is one of very few free tools built specifically to handle the kind of large, multivariate dataset the specifications now require pupils to explore. CODAP makes exploring it the point, rather than treating it as a data-cleaning chore.